Introduction
Excel is a powerful tool used by businesses and individuals to organize, analyze and present data. One of the most useful and common ways to present this data is by making graphs in Excel. Charts and graphs are an effective way to communicate complex data in a clear and easily understandable format. Whether you’re creating a sales report, tracking progress on a project, or analyzing website traffic, Excel charts can help you visualize and understand your data better.
In this article, we’ll provide a step-by-step guide to creating charts in Excel. We’ll also cover some advanced tips and tricks to give your charts a more polished and professional look. In addition, we’ll compare Excel charts to other charting tools and provide real-world case studies so you can see examples of how charts can be used to analyze data.
Step-by-Step Guide: How to Make Graphs in Excel
To begin, you’ll need to select the data that you want to chart. This data can be in any location in your workbook but it’s usually on a separate worksheet. Once you have your data selected, follow these steps:
1. Click on the ‘Insert’ tab in the Excel ribbon
2. Select the chart type that you’d like to use from the ‘Charts’ group of options
3. Excel will automatically create a chart with your selected data. You can customize the chart type, layout, and data range by clicking on the various options in the ribbon.
Selecting the right chart type
Choosing the right chart type is important to ensure that you convey your data effectively. Excel offers a variety of chart types and subtypes to choose from. Some of the most common chart types include:
– Column charts
– Line charts
– Pie charts
– Bar charts
– Area charts
Each chart type represents data in a different way, so it’s important to choose the appropriate one for your needs. For instance, a column chart is great for comparing data across categories, while a line chart is better for showing trends over time. A pie chart is useful when showing percentages of a whole.
Formatting the chart
Once you’ve selected the appropriate chart type, you can customize it to meet your needs. Excel offers a number of formatting options including changing the chart style, applying chart layouts, and modifying colors. You can also add titles and labels to your chart to help clarify your data.
Adding titles and labels
Always make sure to label your chart axis and include a descriptive title that summarizes the main point of the data represented. It will make it easier for your audience to interpret the chart and understand its key insights. To add chart axis or title:
1. Click on the chart to open ‘Chart Tools’
2. Next, select the ‘Chart Layout’ tab
3. Click on ‘Axis Titles’ to add chart title or axis labels
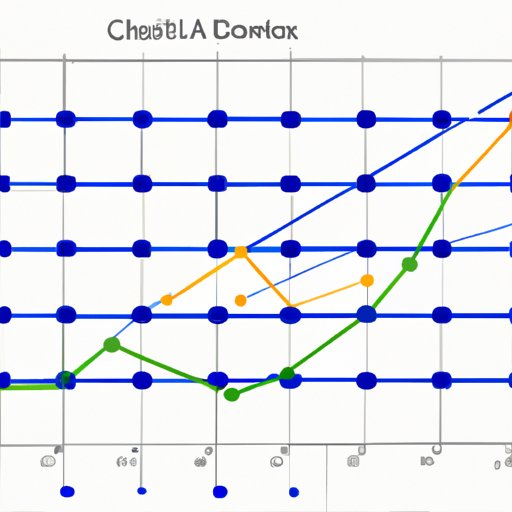
Infographic: Different Types of Charts in Excel
Sometimes, choosing the right chart type can be a bit challenging, especially for those who don’t have much experience with charting. That’s why we’ve created an infographic that showcases the different types of charts available in Excel and explains their key characteristics. The infographic will help you choose the right chart for your data and make it easy to understand the various customization options available in Excel.
Some examples include:
– Bar Chart: great for comparing values across categories.
– Line Chart: perfect for showing trends over time.
– Pie Chart: useful for showing relative proportions of different categories.
– Scatter Chart: ideal for analyzing the relationship between two variables.
Video Tutorial: Creating Charts in Excel
Sometimes, it’s helpful to have a visual demonstration of how to create charts in Excel. That’s why we’ve created a video tutorial that guides users through the process. In the tutorial, we’ll show you how to create different types of charts, apply custom formatting, and organize the chart to make it more visually appealing.
Advanced Tips and Tricks: Making Charts in Excel
For experienced Excel users, there are some advanced tips and lesser-known options that can help take your charts to the next level. For instance, you can customize chart templates, format charts to meet specific requirements, and create charts suitable for presentation. These tips can help you create charts that are not only visually appealing but also insightful and actionable.
Comparison: Excel Charts vs. Other Charting Tools
Excel is only one tool available for chart creation, and it is important to compare it to other similar tools like Google Sheets, Tableau, or Power BI. This will help you decide which tool is better suited for your needs based on features, versatility, and ease of use. When comparing Excel charts with other charting tools, it is important to note that while some additional features are available in other tools, Excel charts are great considering easy access on almost every computer system.
Case Studies: Real-World Examples of Charts in Excel
To give you a deeper insight into how to use charts for analyzing data, we have selected real-world examples that demonstrate how charts can be used in different industries. These examples will show how you can effectively use Excel charts to summarize data visually and present it in a way that is easy to understand.
Conclusion
In conclusion, Excel charts can be a powerful tool to help you analyze and present data. By following the step-by-step guide and using the different resources provided, we hope that you will be able to create charts that are both visually appealing and informative. Excel supports an array of chart types for different kinds of data, and we have provided enough information and examples for you to make well-informed decisions. We encourage you to practice creating charts and using the advanced features to improve your charting skills in Excel.


